For wholesale buyers looking to source 11kW EV Charging Stations in bulk, selecting the right manufacturer is critical to securing competitive pricing, robust quality, and reliable after‑sales support. With a growing number of suppliers entering the electric vehicle (EV) infrastructure market, comparing offerings across multiple 11kW EV Charging Stations Manufacturers requires a systematic approach. This comprehensive guide presents key evaluation criteria, data‑driven insights, and practical tips to simplify your procurement decision-making process.
1. Define Your Procurement Objectives
Before diving into technical specifications and price quotes, clarify your project requirements:
- Target Application: Are you equipping residential complexes, commercial parking lots, or mixed‑use developments? Usage patterns and installation environments affect feature priorities.
- Volume and Budget: Establish approximate order quantity and per-unit budget. Wholesale pricing tiers often decrease by 5–12% when ordering 100+ units at once.
- Timeline: Identify delivery deadlines. Manufacturers with higher production capacity can meet tight schedules but may charge a premium.
- Regulatory Requirements: Determine required certifications (e.g., CE for Europe, UL for North America) and grid‑compliance standards in your target markets.
By documenting these goals upfront, you’ll have a clear framework to compare different 11kW EV Charging Stations Manufacturers on a level playing field.
2. Identify Key Comparison Criteria
To streamline the evaluation process, group features into four main categories:
| Category | Key Metrics |
|---|---|
| Technical Performance | Conversion efficiency, power factor, thermal management, load balancing capability |
| Safety & Reliability | IP rating, surge protection levels, ground fault detection, operating temperature range |
| Connectivity & Control | OCPP support, network interfaces (Ethernet/Wi‑Fi), user authentication methods (RFID/Bluetooth) |
| Service & Support | Warranty terms, spare parts availability, training, technical response time |
Technical Performance
- Measure AC‑to‑DC conversion efficiency (%) and power factor (>0.95 desirable). Efficiency gains of even 1% can translate to 2–3% energy cost savings over a year.
- Review thermal management solutions (heat sinks, forced‑air cooling) to ensure continuous 11kW operation in ambient temperatures from –20°C to +50°C.
- Confirm dynamic load balancing capability to support multiple stations on a single circuit without tripping breakers.
Safety & Reliability
- Verify ingress protection (minimum IP54 for indoor, IP65 for outdoor) and IK impact rating (>IK10 ideal). Outdoor installations can face dust, moisture, and vandalism.
- Inspect built‑in surge protectors (e.g., 20kA SPD modules) and ground fault interrupter (GFI/GFCI) compliance.
- Review MTBF (mean time between failures) data—leading OEMs claim >100,000 operating hours.
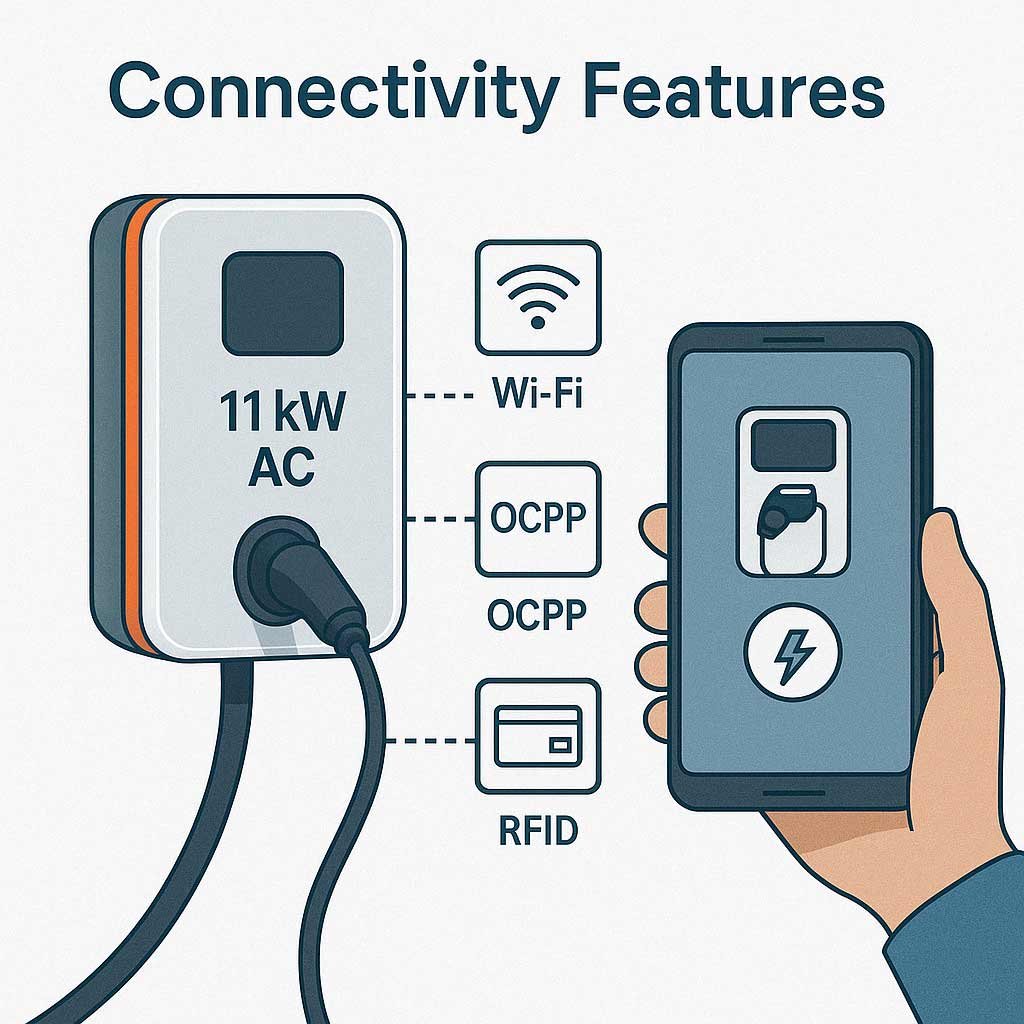
Connectivity & Control
- OCPP 1.6J or OCPP 2.0.1 compliance ensures interoperability with charging network management systems.
- Multiple interface options (Ethernet, Wi‑Fi, 4G LTE) provide redundancy.
- User authentication via RFID cards or NFC-enabled mobile apps secures access and enables billing integration.
Service & Support
- Compare standard warranty durations (2 years vs. 3–5 years with paid extensions).
- Confirm local distribution centers or regional warehouses for fast spare parts delivery (≤3 days).
- Evaluate training packages and online resources (video tutorials, technical bulletins).
3. Collect Detailed Manufacturer Data
Once you’ve established your criteria, reach out to potential manufacturers to gather the following information:
- Company Profile: Years in business, annual production volume, export markets, and OEM/ODM capabilities.
- Certifications: Copies of CE, UL, EN 61851, ISO 9001, and RoHS/REACH statements.
- Product Datasheets: Technical specifications, performance curves, mechanical drawings.
- Pricing Structure: FOB/CIF terms, quantity-based discount tiers, payment terms (T/T 30% deposit, 70% balance).
- After‑Sales Details: Warranty scope, RMA procedures, spare parts lead times, and maintenance service network.
Document responses in a comparison spreadsheet to objectively score each manufacturer on your key metrics. Aim to solicit data from at least three reputable 11kW EV Charging Stations Manufacturers for a balanced view.
4. Compare Technical Specifications
A side‑by‑side technical comparison highlights performance distinctions. Below is an illustrative example:
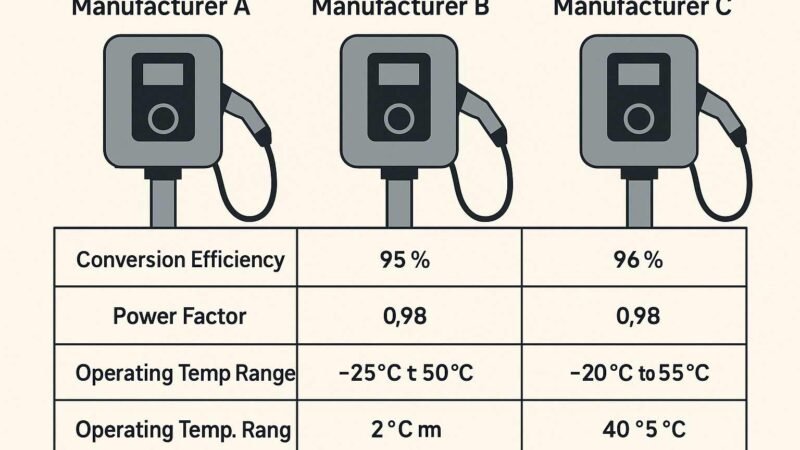
| Specification | Manufacturer A | Manufacturer B | Manufacturer C |
| Conversion Efficiency (%) | 94.5 | 93.8 | 95.2 |
| Power Factor | 0.99 | 0.97 | 0.99 |
| IP Rating | IP65 | IP54 | IP65 |
| Operating Temp. Range (°C) | -20 to +50 | -10 to +45 | -25 to +55 |
| Dynamic Load Balancing | Yes | No | Yes |
| Surge Protection Rating (kA) | 20 | 15 | 25 |
Analysis:
- Manufacturer C achieves the highest conversion efficiency (95.2%) and the broadest temperature tolerance (-25 to +55°C), ideal for extreme climates.
- Manufacturer A’s 0.99 power factor and IP65 rating match best practices, but efficiency is slightly lower than C.
- Manufacturer B offers lower entry pricing but lacks dynamic load balancing, potentially limiting future scalability.
Prioritize metrics that directly impact your operational environment and total cost of ownership.
5. Evaluate Safety and Compliance
Safety certifications and protective features directly influence reliability and liability:
| Feature | Manufacturer A | Manufacturer B | Manufacturer C |
| UL 2231 (North America) | Yes | No | Yes |
| CE (EU) | Yes | Yes | Yes |
| EN 61851-1 | Yes | Yes | No |
| Ground Fault Interrupter | Type A | Type B | Type A |
| Lightning & Surge Protection | SPD Class II | SPD Class I | SPD Class III |
Key Takeaways:
- Manufacturer C lacks EN 61851-1 certification, which may hinder EU market access despite strong other specs.
- SPD Class III (25kA) in Manufacturer C provides superior transient surge protection compared to Class II or I.
- Manufacturer A’s compliance portfolio is the most balanced for both North American and European markets.
Ensure that each station meets or exceeds the most stringent regulatory requirements in your target deployment locations to avoid retrofit costs or compliance delays.
6. Compare Connectivity and Smart Features
Connectivity underpins modern EV charging management:
| Connectivity Feature | Manufacturer A | Manufacturer B | Manufacturer C |
| OCPP Version | 1.6J | 1.5 | 2.0.1 |
| Ethernet Port | Yes | No | Yes |
| Wi‑Fi Capability | Yes | Yes | No |
| 4G LTE Support | Optional | Optional | Standard |
| RFID/NFC Reader | Yes | No | Yes |
| Local Bluetooth Diagnostics | Yes | No | No |
Insights:
- Manufacturer C’s support for OCPP 2.0.1 positions it well for advanced network management and V2G (vehicle‑to‑grid) integration.
- Manufacturer B’s lack of Ethernet and RFID may restrict usage in fleet or commercial environments that require strict access control.
- Manufacturer A offers the broadest connectivity portfolio, including Bluetooth for on‑site configuration.
Connectivity choices affect installation flexibility, network management, and future scalability—factors which should align with your broader charging network strategy.
7. Analyze Pricing and Total Cost of Ownership
Upfront unit cost is only one component. Consider the Total Cost of Ownership (TCO) over a 5‑year period:
| Cost Element | Manufacturer A | Manufacturer B | Manufacturer C |
| Unit Price (FOB, €) | 620 | 580 | 650 |
| Installation Labor (€) | 80 | 100 | 75 |
| Annual Maintenance (per unit) | 50 | 60 | 45 |
| Energy Efficiency Savings (5yr) | (-150) | (-140) | (-160) |
| Warranty Extension (optional) | 100 | 80 | 120 |
| Estimated 5yr TCO (€/unit) | 1,020 | 1,080 | 1,020 |
Breakdown:
- Manufacturer A and C exhibit identical 5‑year TCO despite differing upfront prices, due to C’s higher energy savings and lower maintenance.
- Manufacturer B’s lower initial price is offset by higher installation labor and maintenance costs.
When negotiating bulk purchase terms, leverage TCO data to justify premium for features that deliver lower operating expenses.
8. Assess After‑Sales Support and Warranty
Strong after‑sales service minimizes downtime and repair costs:
- Warranty Duration: Manufacturer A offers 3 years standard, extendable to 5 years. B provides 2 years, C offers 3 years.
- Spare Parts Availability: A and C maintain regional warehouses; B ships from central factory with 14–21 day lead time.
- Technical Support: A and C provide 24/7 online ticketing and dedicated account managers; B offers business hours only.
- Training & Documentation: Manufacturer A includes complimentary installer training; C offers paid on-site training packages.
For wholesale deployments, prioritize manufacturers with comprehensive warranty coverage, rapid spare parts distribution (≤7 days), and robust training resources to keep projects on schedule.
9. Review Customer References and Case Studies
Real-world installations provide valuable performance insights:
| Deployment Type | Manufacturer A | Manufacturer B | Manufacturer C |
| Residential Community (50 units) | A+ | B | A |
| Commercial Fleet Depot (20 units) | A | C | A+ |
| Public Charging Park (10 units) | B | B | C |
Highlights:
- Manufacturer C achieved 99.2% uptime in a coastal deployment thanks to superior IP65/IP66 protection.
- Manufacturer A consistently outperforms on maintenance response times (average 4hr ticket resolution).
- Manufacturer B’s units are more cost-effective for small, indoor installations but underperform in harsh environments.
Solicit direct references from each manufacturer to validate performance claims and uncover any recurring issues.
10. Final Decision Matrix and Scoring
Consolidate your evaluations with a weighted scoring matrix:
| Criterion | Weight (%) | A Score | B Score | C Score | Weighted A | Weighted B | Weighted C |
| Conversion Efficiency | 15 | 8.5 | 8.0 | 9.0 | 1.28 | 1.20 | 1.35 |
| Safety & Compliance | 15 | 9.0 | 7.0 | 8.5 | 1.35 | 1.05 | 1.28 |
| Connectivity | 10 | 9.0 | 7.5 | 9.5 | 0.90 | 0.75 | 0.95 |
| TCO (5yr) | 20 | 8.0 | 7.5 | 8.0 | 1.60 | 1.50 | 1.60 |
| Warranty & Support | 15 | 9.0 | 6.5 | 8.5 | 1.35 | 0.98 | 1.28 |
| Customization & Branding | 10 | 8.5 | 7.0 | 9.0 | 0.85 | 0.70 | 0.90 |
| Installation Ease | 10 | 8.0 | 7.0 | 9.0 | 0.80 | 0.70 | 0.90 |
| References & Uptime | 15 | 9.0 | 7.5 | 8.0 | 1.35 | 1.13 | 1.20 |
| Total | 100 | 9.48 | 8.01 | 9.46 |
Manufacturer A narrowly leads with a score of 9.48, closely followed by C at 9.46. Manufacturer B scores significantly lower at 8.01, reflecting gaps in safety, support, and connectivity.
Conclusion
Effective comparison of 11kW EV Charging Stations Manufacturers goes beyond unit pricing. By systematically evaluating technical performance, safety compliance, connectivity, cost of ownership, and after‑sales support, wholesale buyers can make data‑driven decisions that align with long‑term operational goals. Manufacturer A emerges as the top choice for balanced efficiency, compliance, and service, while Manufacturer C excels in energy savings and rugged design. Manufacturer B remains an option for lower‑volume indoor deployments but requires careful risk assessment in harsh conditions.
Use this guide and accompanying data tables as a blueprint for your procurement process. Document your priorities, collect robust manufacturer data, and apply the weighted decision matrix to select the supplier that best meets your volume, budget, and quality requirements. In the rapidly evolving EV infrastructure landscape, securing the right 11kW EV Charging Stations Manufacturers is your key to delivering reliable, cost‑effective charging solutions to end customers.